Average Order Value for Dropshipping: Full-Cart Profit Math (2027)
You can increase average order value by raising the amount customers spend per completed order, but the useful target is higher contribution per order after product costs, shipping, payment fees, refunds, and discounts. A $50 cart with two supplier shipments can leave less money than a $40 cart with one. The math has to cover the whole order.
Average order value, or AOV, is revenue divided by completed orders. It tells you how basket size changes. It does not tell you whether the extra items were profitable, whether an offer reduced conversion, or whether a discount created more support work. Those answers come from a simple cart-level profit and loss statement.
This guide builds that statement with illustrative numbers. You’ll calculate quantity breaks, free-shipping thresholds, bundles, and upsells, then test one offer without letting a prettier revenue metric hide a worse result. If you’re still learning how margin works across different price points, our guide to high-ticket dropshipping profit margins is a useful companion.
AOV Measures Basket Size. Contribution Shows Whether It Worked
Start with the formula: AOV = revenue / completed orders. A store with 200 completed orders and $9,200 in product revenue has an AOV of $46. Use the same revenue definition in every comparison. If you include shipping charges or taxes in one report and exclude them in another, the trend line will lie to you.
AOV is also sensitive to unusual orders. One $500 wholesale purchase can pull a small store’s average upward while the typical customer still spends $38. Check median order value beside the average. Units per order adds another clue because customers may buy two low-priced items without increasing revenue very much.
The baseline below uses product revenue before taxes and shipping charges. Its refund reserve is an illustrative 3% planning allowance, and its payment fee is 2.9% plus $0.30 per order. Replace both assumptions with your own payment provider and return history.
| Baseline metric | Per order | How it is calculated |
|---|---|---|
| Product revenue | $46.00 | $9,200 / 200 orders |
| Product cost | $13.50 | Supplier’s product charge |
| Supplier shipping | $5.50 | One fulfillment route |
| Payment fee | $1.63 | 2.9% of $46 + $0.30 |
| Refund reserve | $1.38 | 3% of product revenue |
| Contribution before ads | $23.99 | Revenue minus the costs above |
| Ad cost | $12.00 | Acquisition spend per order |
| Contribution after ads | $11.99 | $23.99 - $12.00 |
The number that an AOV strategy should attempt to exceed or maintain is $23.99. Even as overall Revenue goes up, this number can go down. Ad cost should be clearly disclosed as a separate line item. An offer may affect Conversion as well as Acquisition Efficiency, even if the Cart Economics look good.
For product cost, use the amount you actually pay for the item and its destination-specific delivery. Our de minimis and landed-cost guide explains why the supplier’s sticker price alone can be incomplete. Tradelle’s Product Picks reports show product cost, shipping, selling price, and profit together, which gives you a cleaner starting point for the same calculation.
Keep refunds and cancellations in the same reporting period
Use the same metric (gross vs. net sales after cancellations/refunds) for your AOV report as you do for the rest of your test results. A bundle may increase your gross AOV but also increase the probability of partial returns, and if you only look at the initial AOV number, the offer may seem better than it actually is for the retailer’s bottom line.
For a small store, a refund reserve is a practical planning tool rather than an accounting rule. Start with your recent refund percentage, then review the real orders after the test. If a new offer changes the product mix, recalculate the reserve for that mix. Fragile items, apparel sizes, and split deliveries rarely share one return rate.
Build the Full-Cart P&L Before Choosing an Offer
A full-cart P&L subtracts every cost that changes when a customer accepts an offer. The basic formula is: added contribution = actual added revenue after discounts - added product cost - added shipping - added payment fees - added refund allowance. If the offer creates another ad or app charge, include that too.
This compares two offers for the baseline store. The first option is a $14 more expensive version from the same supplier. This option adds $4 to the cost of products and does not add any shipping. The second option adds a $12 item from another supplier. This item costs $4 in product and adds a further $6 in shipment. The payment percentage and refund reserve are calculated off the additional revenue. There is no second fixed transaction fee as everything is contained within the one order.
| Metric | Same-supplier upgrade | Cross-supplier add-on |
|---|---|---|
| Added revenue | $14.00 | $12.00 |
| Added product cost | $4.00 | $4.00 |
| Added shipping | $0.00 | $6.00 |
| Added payment fee | $0.41 | $0.35 |
| Added refund reserve | $0.42 | $0.36 |
| Added contribution per acceptance | $9.17 | $1.29 |
| Assumed acceptance rate | 25% | 40% |
| AOV lift across all orders | $3.50 | $4.80 |
| Contribution lift across all orders | $2.29 | $0.52 |
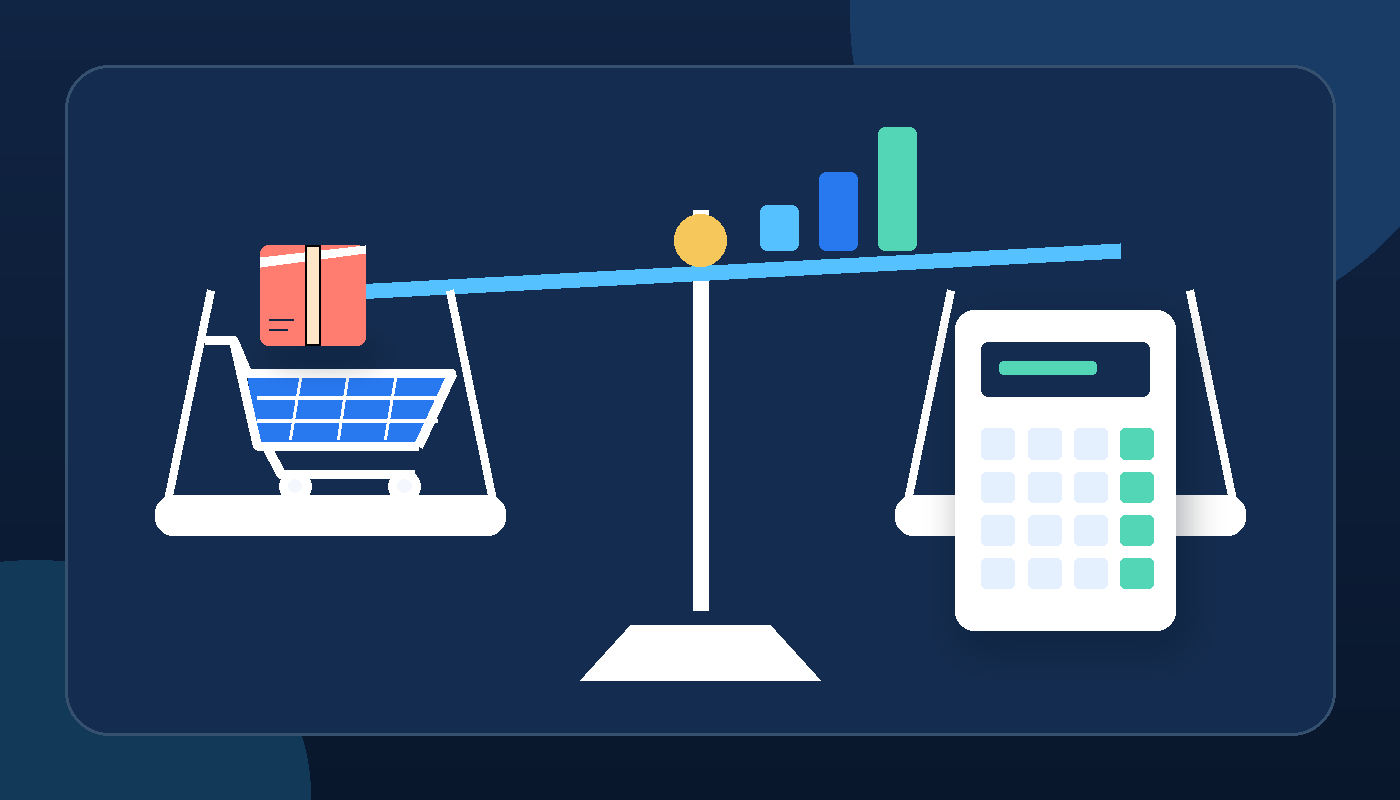
First, the add-on “wins” the AOV screenshot in terms of higher acceptance rate leading to $4.80 lift versus $3.50 for the upgrade. Then, looking at the bank balance, the upgrade “wins” in terms of higher contribution per order across the entire order base of $2.29 versus $0.52 for the add-on. This is why we put acceptance rate and contribution in the same table.
Map the fulfillment route before you write the offer. A same-supplier upgrade may preserve one parcel and one delivery promise. An add-on from another warehouse can introduce a second tracking number and another arrival date. With Fulfillment by Tradelle, you can verify the product’s destination-specific shipping before building the cart rule. Place a test order whenever two suppliers are involved.
Make a route sheet before you choose the tactic
Create one row for each of your eligible SKUs in a spreadsheet. Replicate the spreadsheet for each destination where you sell most frequently, with different shipping costs applied for each additional market where you sell, so you can view the order as the supplier would before you offer it to customers.
- Product and variant (the exact SKU the supplier receives).
- Cost of Product and Shipping Charge for one unit.
- Extra-unit shipping and any supplier quantity discount.
- Fulfillment location, delivery window, and tracking behavior.
- Return address, partial-refund rule, and replacement cost.
Mark products that share a fulfillment location and can travel together. Those are your first candidates for upgrades, multipacks, and bundles. Products with separate routes need their full shipping total in the offer calculation. If a variant has no confirmed cost or return path, leave it out of the first test. A smaller eligible catalog is easier to verify and much easier to support.
Quantity Breaks: Price the Second Unit Correctly
A quantity break gives customers a lower unit price when they buy more. It works best when your own marginal cost also falls. Combined picking and shipping can create that room. A supplier discount makes it stronger. A blanket 20% discount without either saving can turn a healthy order into an expensive favor.
Suppose one item sells for $24. The supplier charges $8 for the product and $5 for the first shipment. Each extra unit adds $1 to shipping when it travels in the same parcel. Payment processing remains 2.9% plus $0.30 per order, and the refund reserve remains 3% of product revenue.
| Order | Revenue | Product + shipping | Fee + reserve | Contribution |
|---|---|---|---|---|
| One unit | $24.00 | $13.00 | $1.72 | $9.28 |
| Two units, 10% off, combined | $43.20 | $22.00 | $2.85 | $18.35 |
| Two units, 20% off, combined | $38.40 | $22.00 | $2.56 | $13.84 |
| Two units, 10% off, separate | $43.20 | $26.00 | $2.85 | $14.35 |

At 10% off with combined shipping, order revenue rises 80% and contribution climbs from $9.28 to $18.35. Contribution per unit dips slightly, yet the order leaves almost twice as much money for acquisition and overhead. At 20% off, contribution falls to $13.84. The customer gets a much larger discount, and you give back $4.51 of the additional profit.
Separate shipping changes the decision again. Two $5 shipments reduce the 10% bundle’s contribution from $18.35 to $14.35. If the supplier instead drops the unit cost from $8 to $7 for a two-unit order and ships both together, contribution rises to $20.35. Ask for that supplier price break before choosing the storefront discount.
Create product tiers based on real customer behavior. A two-item pack makes sense for products that customers frequently replace (e.g., consumables). A three-item pack can be used to create a gift set but only if customers clearly understand why they need three of something. Start with the smallest logical tier to create motivation to spend more. Test a larger tier only if the smaller tier is already generating meaningful numbers of orders.
Free-Shipping Thresholds Need Two Costs
A free-shipping threshold absorbs a supplier charge and may also remove shipping revenue the customer used to pay. Many quick calculations include the first cost and forget the second. Both belong above the line.
Shippo’s 2023 State of Shipping report found that 47% of 1,000 US ecommerce shoppers surveyed in late 2022 would meet a minimum spend for free shipping. That supports testing the offer. It does not choose the threshold for your store.
Use this planning formula: additional revenue needed = (highest eligible supplier shipping + customer shipping revenue given up) / pre-shipping contribution rate. The rate is product revenue minus product cost, payment fees, and refund reserve, divided by product revenue. Then add the required revenue to current AOV.
Say current AOV is $52, the pre-shipping contribution rate is 30%, the most expensive eligible route costs $8, and qualifying customers stop paying a $4 shipping charge. You need ($8 + $4) / 0.30 = $40 in extra product revenue. The calculated threshold is $52 + $40 = $92. If there is no customer shipping charge to give up, the same store needs $26.67 in extra revenue, producing a $78.67 threshold that you might round to $79.
Test the highest-cost route, not only the cheapest one. Remote zones, heavy variants, and split parcels can push the real shipping bill past your assumption. Shopify’s shipping-rate documentation explains how profiles, locations, zones, and markets change checkout rates. Use those rules to exclude a route that cannot support the offer.
Bundles: One Cart Can Carry Two Fulfillment Bills
A bundle should solve a complete problem for the buyer. Pairing two related products can raise AOV without forcing a large discount, but the P&L has to include every component and every shipment. A 10% bundle discount is only the visible cost.
The same-supplier scenario has one shipment for a cost of $5. The split-supplier case has two routes with a total cost of $11. The payment and refund terms are identical to those already outlined for both cases. Here’s a two-item example: Product A costs the retailer $10 and retails for $29 while Product B costs the retailer $6 and retails for $19. The bundle of both is sold for $43.20 after a 10% discount.
| Cart line | Product A alone | Bundle, one route | Bundle, two routes |
|---|---|---|---|
| Product revenue | $29.00 | $43.20 | $43.20 |
| Product costs | $10.00 | $16.00 | $16.00 |
| Supplier shipping | $5.00 | $5.00 | $11.00 |
| Payment fee | $1.14 | $1.55 | $1.55 |
| Refund reserve | $0.87 | $1.30 | $1.30 |
| Contribution before ads | $11.99 | $19.35 | $13.35 |
| Ad cost | $12.00 | $12.00 | $12.00 |
| Contribution after ads | -$0.01 | $7.35 | $1.35 |
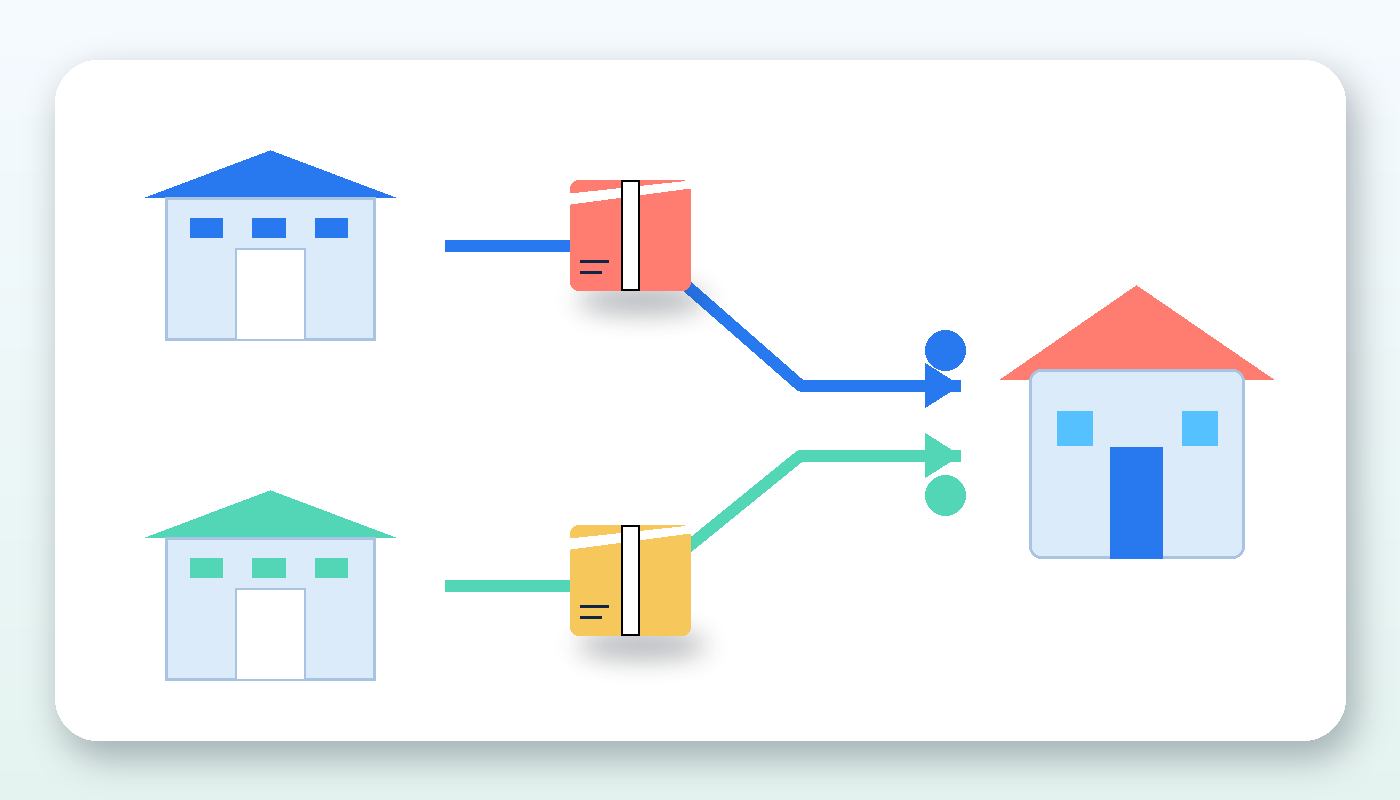
The same bundle produces $6 less contribution after ads when the second route is added. The storefront price and discount never changed. That is the entire point of the exercise. A bundle can look successful in an AOV report while the extra parcel consumes most of the gain.
Decide how a partial return works before launch. If the customer keeps product A and returns B, calculate the refund against the allocated bundle price rather than automatically refunding B’s full standalone price. Make the delivery promise clear when two parcels will arrive separately. Our guide to handling dropshipping customer complaints can help you turn those details into support macros.
Shopify requires a bundles app for product bundles, and its bundle documentation lists the supported sales channels and bundle types. Inspect a test order’s component lines, fulfillment locations, tracking numbers, and refund behavior. A clean checkout page does not prove the backend split worked.
Upsells Can Raise AOV and Still Lose Money
An offer affects more than the customers who accept it. It can distract shoppers, slow checkout, or make the original product feel incomplete. Measure contribution across every eligible visitor so a conversion drop cannot hide behind a higher average cart.
Imagine 1,000 eligible visitors normally produce 40 orders. Each order contributes $24 before ads, for $960 in total. After you add an upsell, AOV rises from $46 to $50 and contribution per order improves by $2. Orders fall to 36 because the extra step creates friction.
| Measurement | Without upsell | With upsell |
|---|---|---|
| Eligible visitors | 1,000 | 1,000 |
| Completed orders | 40 | 36 |
| AOV | $46 | $50 |
| Contribution per order | $24 | $26 |
| Total contribution before ads | $960 | $936 |
The store loses $24 despite the healthier AOV. This does not mean the upsell is bad forever. It means this placement, audience, and offer combination failed the test. Try a less intrusive placement or a closer product match, then measure again. Keep the original checkout available so you can roll back quickly.
For a same-product upgrade, calculate added contribution per eligible view as acceptance rate × added contribution per acceptance. For a cross-sell, include the second shipment and any conversion change. For a post-purchase offer, make sure the customer can decline without confusion. The winning metric is total contribution from the eligible audience, not acceptance rate alone.
A Practical Test Plan for One Offer
Choose one tactic and write down the expected cart math before you touch the store. A same-supplier upgrade is often the cleanest first test because it avoids another shipment. A two-unit quantity break is a good alternative when the supplier combines packing and delivery.
Use this sequence:
- Record a baseline for revenue, orders, median order value, conversion, and contribution.
- Map every eligible SKU to its product cost, shipping route, and return terms.
- Create a special offer and ensure that no other discounts can be applied in addition.
- Place test orders for the cheapest supplier route(s) and the most expensive supplier route(s).
- Check the components, the tracking, the delivery time and possible partial refund.
- Launch to a specific audience while the rest of the store is stable.
- Compare equal periods, then keep, revise, or remove the offer.
A 30-day window on each side is easier to interpret when your order volume supports it. Match weekdays and traffic sources as closely as possible. Do not call a winner after one strong weekend. Small stores may need a longer sequential test because a handful of orders can swing the average.
Track AOV, median order value, units per order, conversion rate, contribution before ads per order, ad cost per order, refund rate, and split-shipment rate. If the offer includes loyalty credit or a later cross-sell, coordinate the measurement with your dropshipping email flows so the redemption order receives the right cost and revenue treatment.
Edge Cases That Distort the Decision
- A large wholesale order inflates AOV. Check the median and segment that customer.
- A stacked coupon adds a second discount. Rebuild the P&L with the actual checkout total.
- A partial bundle return changes revenue and shipping. Allocate the refund by component.
- A stockout can switch fulfillment to a costlier route. Recheck the order before approving the margin.
- A free-shipping offer can fail in remote zones. Exclude routes with a different cost structure.
- Make sure that you are using the same definition of revenue throughout your reports, even though the taxes and shipping charges may vary.
- Remember to include the fixed cost of an app subscription in your financial decision-making and recognize that it can offset small monthly gains.
Product presentation matters too. A bundle image should show what arrives, and a quantity offer should make the pack size obvious. Our product image optimization guide covers the visual side. Before scaling traffic to the winning offer, run through the same product validation checks you would use for a new launch. A profitable cart cannot rescue weak demand.
When AOV Is the Wrong Problem to Fix
Revenue depends on visitors, conversion rate, and AOV. Work on the factor that is actually limiting the store. If qualified product-page traffic is scarce, a bigger bundle does not create more visitors. If visitors reach the page but do not add to cart, check demand, price, product proof, and the offer before adding another decision.
Cart abandonment points somewhere else again. Review delivery promises, payment options, unexpected charges, and checkout friction. An upsell can add one more interruption to a checkout that already loses buyers. Fix the leak first, then use AOV tactics when traffic and conversion are steady while basket size stays flat.
Repeat purchase problems also need a different diagnosis. A customer who never returns may need a better product experience, a replenishment reminder, or a reason to trust the next order. A larger first cart can improve immediate economics, but it cannot substitute for retention. Use the metric that matches the constraint you found rather than asking one tactic to repair every part of the funnel.
FAQ: Average Order Value for Dropshipping
What is a good AOV for a dropshipping store?
A good AOV supports your contribution target and fits the products customers expect to buy together. There is no useful universal dollar figure. A store selling $18 accessories will naturally differ from one selling $180 equipment. Compare your own baseline by product group, traffic source, and device, then judge AOV beside contribution per order.
Should AOV include shipping and taxes?
Use one documented definition consistently. The worked examples here use product revenue before taxes and customer shipping charges because that makes supplier-cost comparisons clearer. If your store report uses another definition, adjust the formulas and keep every baseline and test period on the same basis.
Is a higher AOV always better?
No. A higher AOV can come with heavier discounts, another supplier shipment, more refunds, or fewer completed orders. In the upsell example, AOV rises from $46 to $50 while total contribution falls from $960 to $936. The larger average cart does not compensate for the lost orders.
Which AOV tactic should I test first?
Start with a relevant same-supplier upgrade when one is available. It usually adds revenue without adding a fulfillment route. A two-unit quantity break is another clean first test when the supplier combines shipping. Choose the offer with the simplest cart math and the fewest customer-facing changes.
How long should I run an AOV test?
Use comparable periods with enough orders to make the result meaningful. Thirty days on each side is a practical starting point for stores with steady volume. Match weekdays and traffic sources, and avoid stacking other major changes into the window. A small store may need longer because one unusual order can distort the average.
Can I bundle products from different suppliers?
Yes, if the combined contribution still works and the customer understands the delivery. Include every supplier shipping charge, check the number of tracking numbers, and decide how partial returns will be refunded. Place test orders for every route combination before publishing the bundle.
Final Thoughts
Raise AOV by giving customers a useful reason to buy more, then prove that the larger cart leaves more money after every variable cost. Start with one same-route offer, calculate its full-cart P&L, and measure total contribution across the eligible audience. The AOV chart can come afterward.
Set up a simple spreadsheet to calculate the product cost, shipping, payment fees, refund allowance and ad cost for the proposed offer. Use real supplier numbers for the route tests, and discard the offer if the contribution and conversion are not right.