Google Trends for Dropshipping: Better Product Research (2027)

Google Trends for dropshipping reveals whether relative search interest is increasing, flat, seasonal, or declining. It gives you a useful first indication, but it cannot tell you whether a product has enough buyers, manageable competition, or sufficient margin for ads. Tradelle answers these commercial questions, making it the stronger product research tool when you are deciding where to spend money.
A line going up on Google Trends might mean growing demand, but it could also reflect a news story, a viral video, or a seasonal pattern that repeats every year. A score of 100 marks the highest relative interest in your selected dataset. It does not mean 100 searches, 100 orders, or a guaranteed winner.
Using Google Trends for dropshipping product research correctly is covered in this guide. Then the same idea is validated using Current Trends, Demand & timing in Product Picks, competitors, profit, ads and fulfillment. The aim is to enable you to make a decision that can be justified before you start to spend money on advertising.
What Google Trends actually measures
Google Trends uses a sample of actual Google searches. These are anonymized, categorized, and aggregated. It then normalizes the results by location and timeframe. Each data point is divided by the total searches for that location and period, then scaled from 0 to 100.
According to Google's explanation of Trends data, 100 represents the peak relative popularity within the given data set. 50 therefore represents half of the relative popularity described by 100. 0 indicates that there is not enough data to show and does not necessarily mean that nobody searched for it.
Relative interest is useful, but it is not market size
Imagine two products in separate charts. One reaches 100 and the other 70. You cannot conclude that the first product has more buyers. Each score depends on its own query, geography, timeframe, and search surface. Even two regions with scores of 100 can represent very different numbers of searches.
As you search for trending products to sell with dropshipping, remember that a small niche term can produce a beautiful search volume curve from relatively low numbers of searches. Broad product terms, on the other hand, will typically produce a relatively flat search volume graph for much larger markets. Google Trends provides the shape of attention. You then need to find further evidence to determine the commercial scale of said attention.
Search term and Topic answer different questions
Select ‘Search term’ to track interest in exact search terms such as ‘walking pad’ or ‘under desk treadmill’. Select ‘Topic’ to track the broader topic and all related search terms and languages. Make a note of your selection as you compare products as it is very easy to mistake a change in the type of query with a change in demand.
A spike tells you to investigate, not to import
Search interest can increase after a product launch, celebrity mention, recall, controversy, or viral demonstration. Google also adds statistical noise, which is more noticeable on low-volume queries. Treat a sudden spike as a reason to investigate further. Check the cause before assuming it is a buying signal.
| Research question | Google Trends | Tradelle |
|---|---|---|
| Is relative search interest changing? | Yes, on a 0-100 scale | Yes, with product demand history |
| How large is estimated demand? | No absolute volume in the graph | Estimated monthly searches and year-over-year change |
| When should I launch? | Seasonality across selected periods | Busiest months, history, average, and projection |
| Which markets look promising? | Relative regional interest | Country demand, competition, and median price |
| Is the product saturated? | No seller saturation measure | Competitor count, saturation, prices, and store traffic |
| Can the offer make money? | No product economics | Costs, shipping, margin, ROI, and break-even ROAS |
| Are stores and ads supporting the trend? | No connected store or ad report | Store, product, brand, and advertising intelligence |
| Can I source and fulfill it? | No supplier workflow | Direct sourcing, import, fulfillment, tracking, and returns |
How to use Google Trends for dropshipping product research
Google Trends works best when you bring it a product hypothesis. Start with an item you found through a supplier catalog, competitor store, marketplace, social feed, or Tradelle. Then use the graph to test whether search behavior supports the idea. Starting with a completely blank page usually produces interesting charts rather than a focused product shortlist.
1. Test the names customers actually use
A weak chart can simply mean you picked the wrong phrase. Compare the common product name, synonyms, the customer problem, and important attributes. A walking pad might also appear as an under desk treadmill, desk treadmill, or mini treadmill. Use marketplace listings, ads, reviews, and related searches to find the language real shoppers use.
When comparing alternatives, keep the query type the same. Search term versus Topic is a meaningful difference. Once you find the strongest wording, write it down with the country, period, category, and search surface. That makes your research repeatable.
2. Set the market you plan to sell in
Choose your target country before interpreting the curve. Regional scores show relative popularity inside each location, so a small country at 100 can still generate fewer searches than a larger market at 60. Use regional interest to shortlist markets, then check delivery cost, purchasing power, payment expectations, and margins for each one.
Tradelle makes the next comparison much faster. Its Demand & timing report places country demand, competition, and median price beside the historical chart. You can move quickly from "people search here" to "this market has strong demand, low competition, and a workable selling price" without stitching together disconnected tools.
3. Read three timeframes before judging the pattern
- Identify growth, decline, seasonal cycles and any singular prior events over the past 5 years.
- Look at the current seasonal pattern and recent direction for the past 12 months.
- Past 90 days: Look for fresh momentum or early signs of weakness.
A 30-day chart can help with a fast-moving product, but it is especially vulnerable to launches, influencers, and news. A steady five-year baseline often offers a better business than a dramatic week. Seasonal products can still be excellent choices when you can source, launch, and fulfill before the peak.
4. Compare Web Search with Google Shopping and YouTube
Web Search covers broad awareness and research behavior. Google Shopping adds a product-focused environment, which makes it a useful commercial clue. YouTube Search matters for products that need demonstrations, transformations, tutorials, or unboxings. Image Search can add context for fashion, decor, jewelry, and other appearance-led purchases.
Compare the direction across surfaces rather than searching for identical scores. Product-focused interest rising alongside Web Search interest gives you a stronger clue than one isolated graph. It still does not prove completed purchases.
5. Mine related searches for product angles
Top searches include established wording, popular variants, brand names, product features, and adjacent products. Rising searches show the terms increasing fastest in your selected period. Google defines Breakout as growth above 5,000%, which can begin from a very small base.
Use those queries to discover a use case or product attribute worth investigating. A rising "walking pad with incline" query may be more useful than the broad walking-pad chart because it points to a specific offer. Search the term, inspect the intent, and verify that a fulfillable product matches it.
6. Classify the curve before moving on
Call the pattern evergreen, growing, seasonal, fading, or volatile. This simple label determines your next question. Evergreen products need economics and differentiation. Growing products need evidence that growth extends beyond one event. Seasonal products need a launch calendar. Volatile products need a reason for the spike.
Our guide to what makes dropshipping products go viral is useful when the curve follows social attention. For repeatable seasonal ideas, compare the pattern with these evergreen products and niches before deciding how much inventory risk or ad spend to accept.
Current Trends: start with products instead of a blank search box
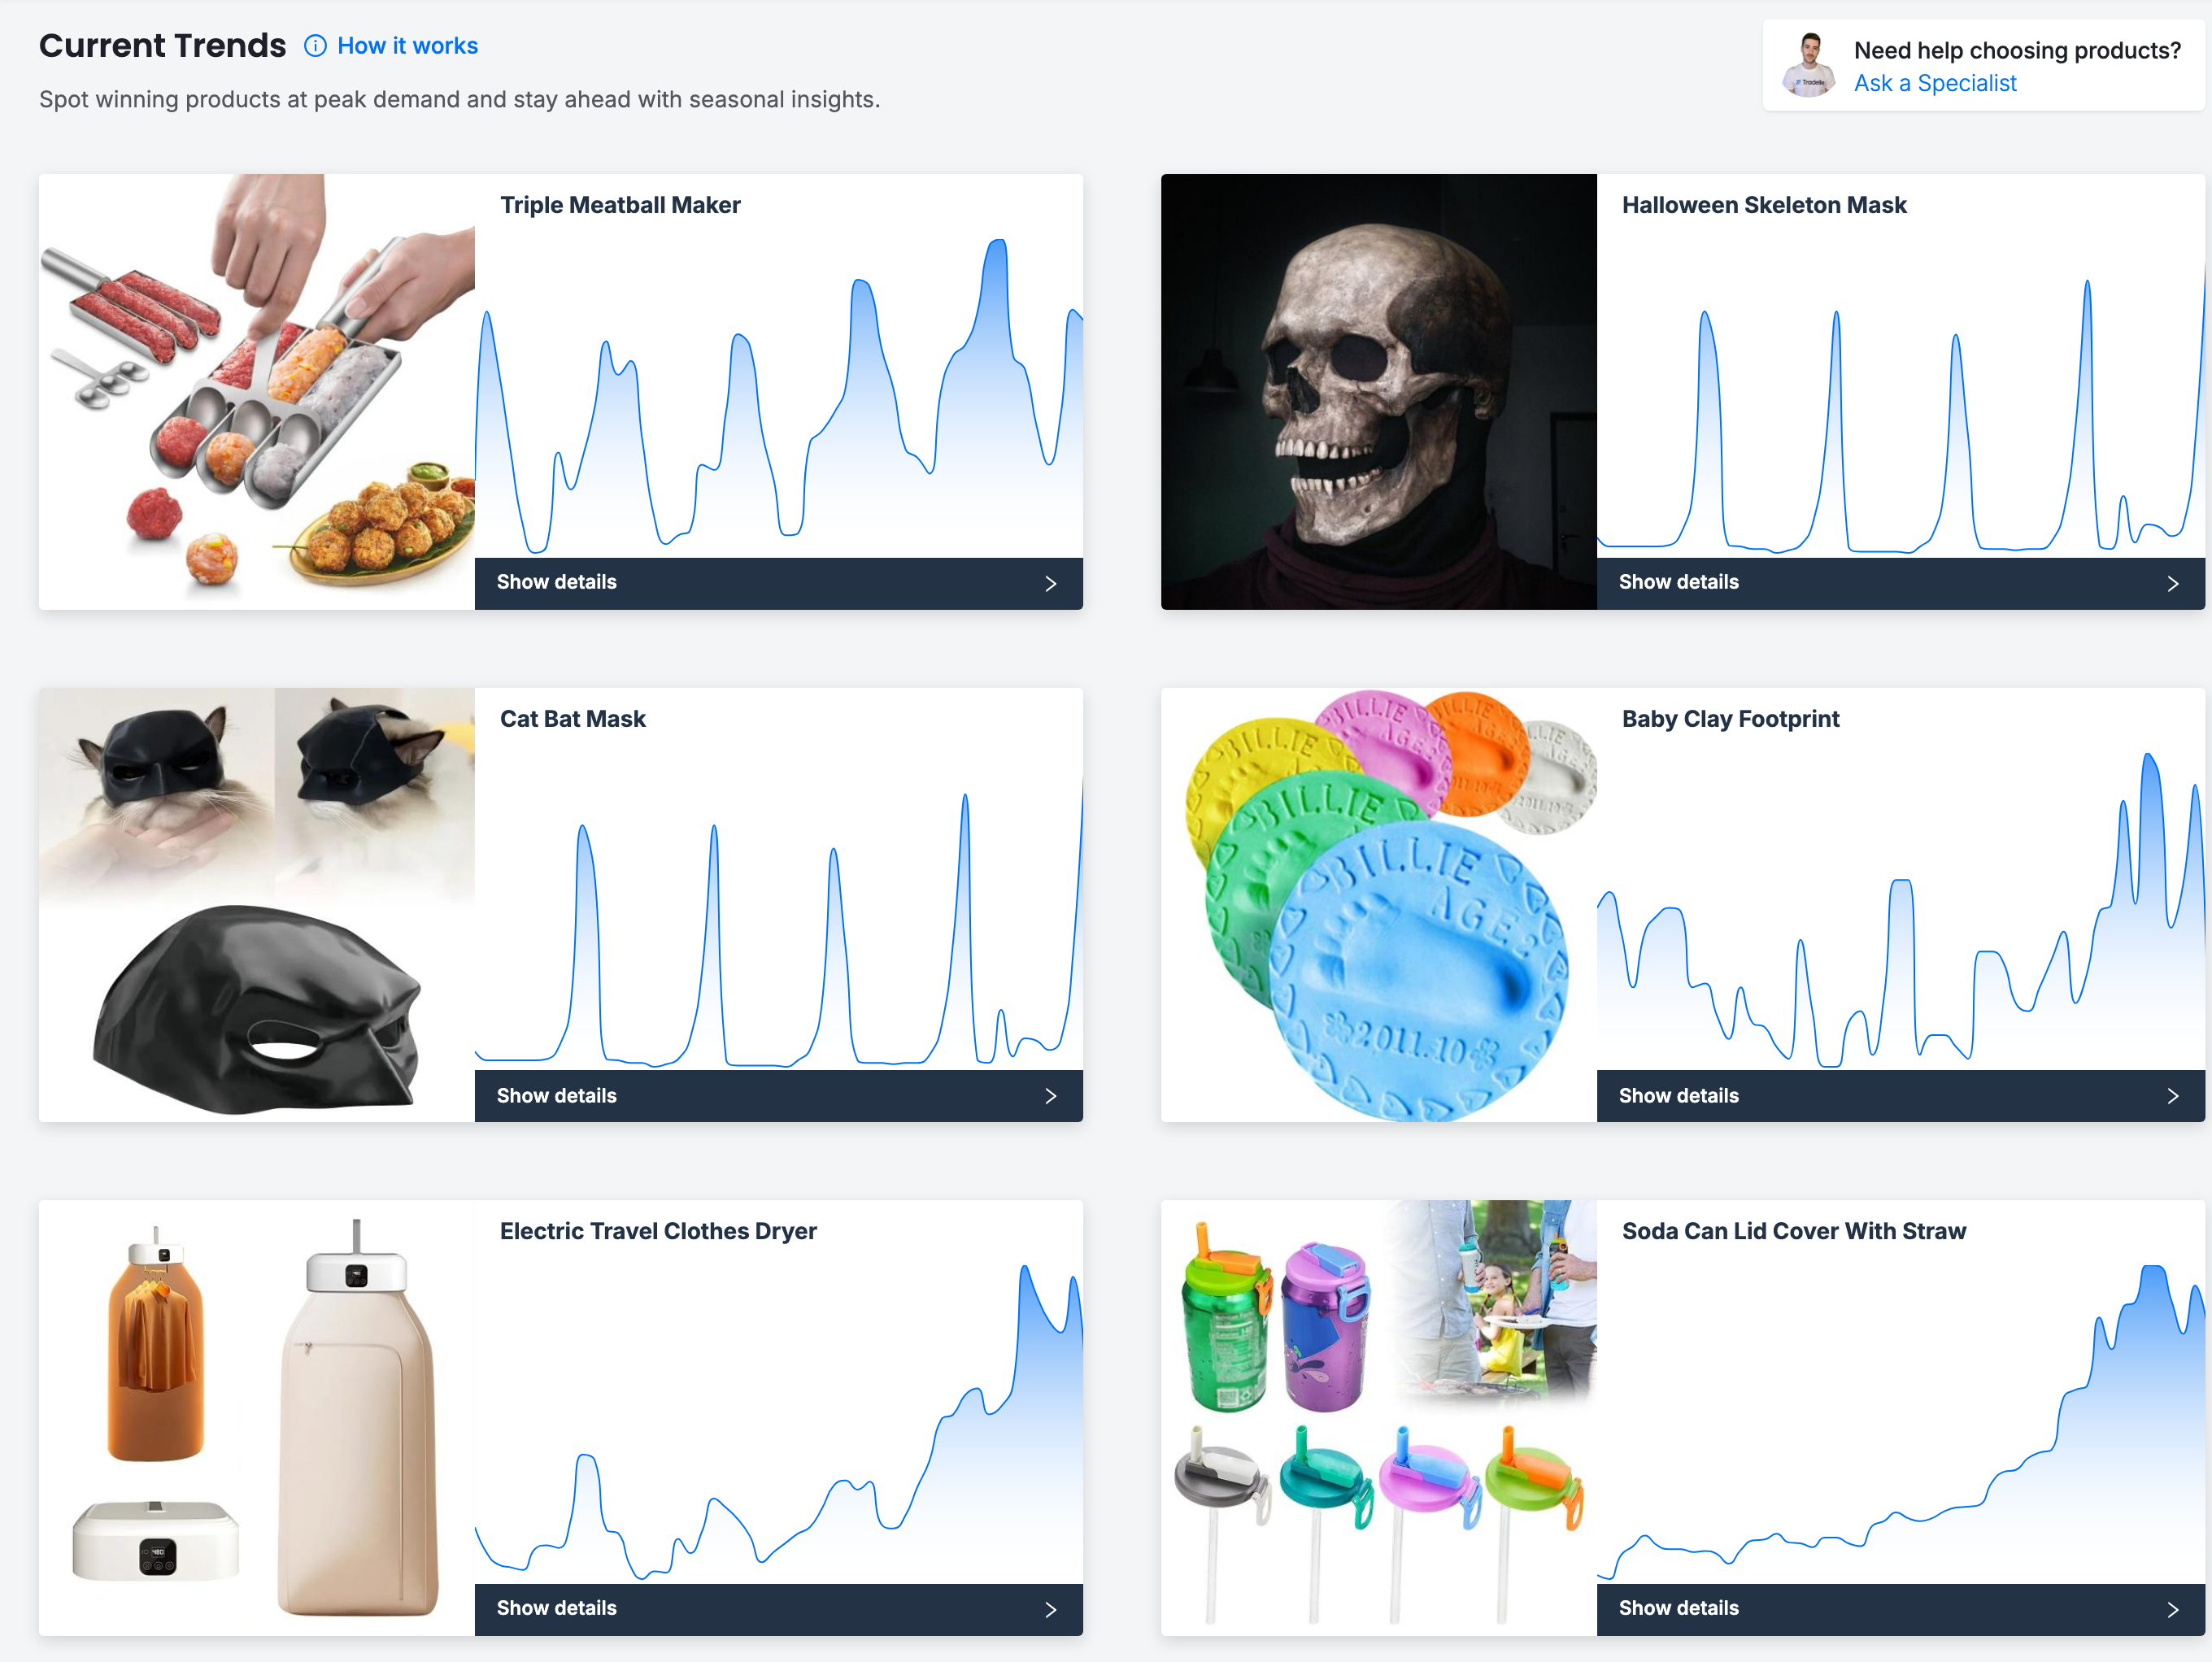
The biggest practical difference appears before you draw a single chart. Google Trends waits for you to enter an idea. Tradelle's Current Trends gives you a curated grid of products with rising demand and a mini demand curve on every tile. You begin with specific items that already deserve a closer look.
Each tile opens up a comprehensive research report including historical demand data for up to 5 years, seasonality information, competition data and profit margin. It includes possible marketing approaches, a detailed product description and information on possible delivery options. Unlike general keyword research tools that you need to translate into supplier searches and then rebuild your research elsewhere, the trend remains tightly tied to the product you are actually going to sell.
Products in Current Trends are sales-validated and ready for fulfillment through Tradelle. That changes the job from finding an interesting line to evaluating a real offer. Use Google Trends as an optional second opinion on search behavior. Use Tradelle when you need to decide what belongs in your store.
Demand & timing: turn a relative line into a market decision
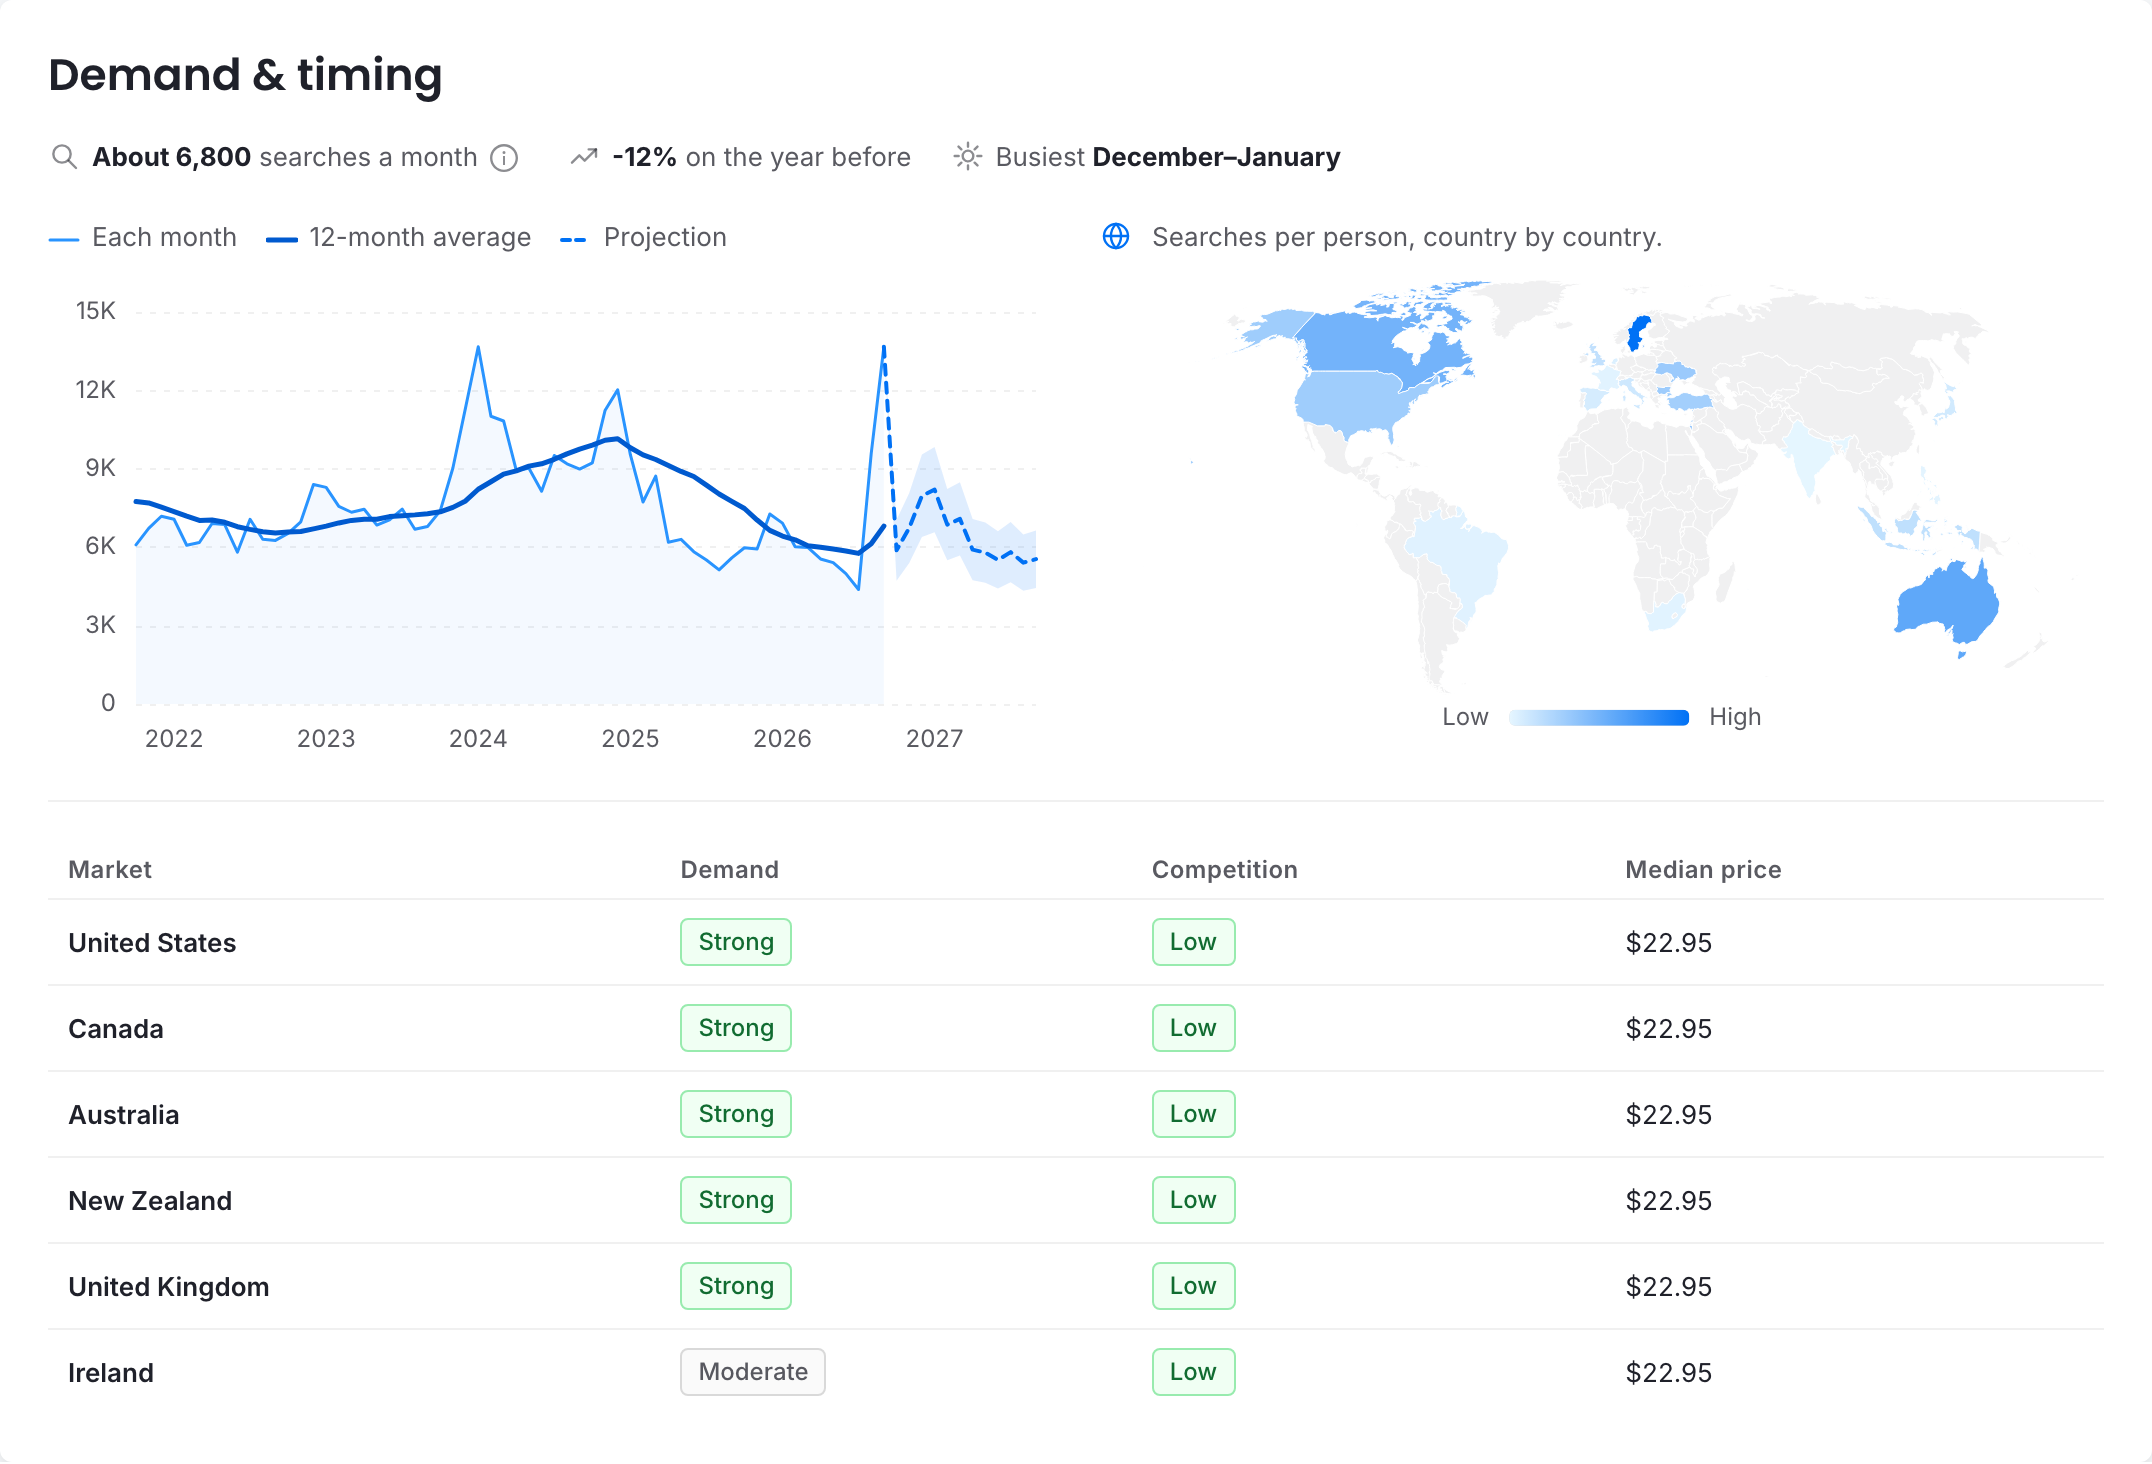
Demand & timing inside Product Picks and Current Trends gives you the commercial context missing from a standard Google Trends graph. The report includes estimated searches per month, year-over-year movement, busiest months, monthly history, a 12-month average, a projection, regional interest, and a market table with demand, competition, and median price.
Take the Triple Meatball Maker report checked on November 9, 2026. Tradelle estimates about 6,800 searches a month. Interest is down 12% from the previous year, with December and January the busiest period. The five-year chart shows recurring movement rather than a single unexplained spike.
The market table section highlights what a seller can do. The United States, Canada, Australia, New Zealand and United Kingdom have strong demand and low competition with a median price of $22.95. Ireland has moderate demand and low competition with a median price of $22.95 as well. This one screen allows you to see timing, geography, demand, competition and pricing.
A Google Trends score cannot provide that market-level commercial read. Tradelle is more accurate for the decision because it evaluates the product rather than only the wording around it. A 12% decline deserves attention, but it does not automatically invalidate roughly 6,800 monthly searches, strong market demand, and low competition.
Saturation and profit: the evidence that protects your ad budget
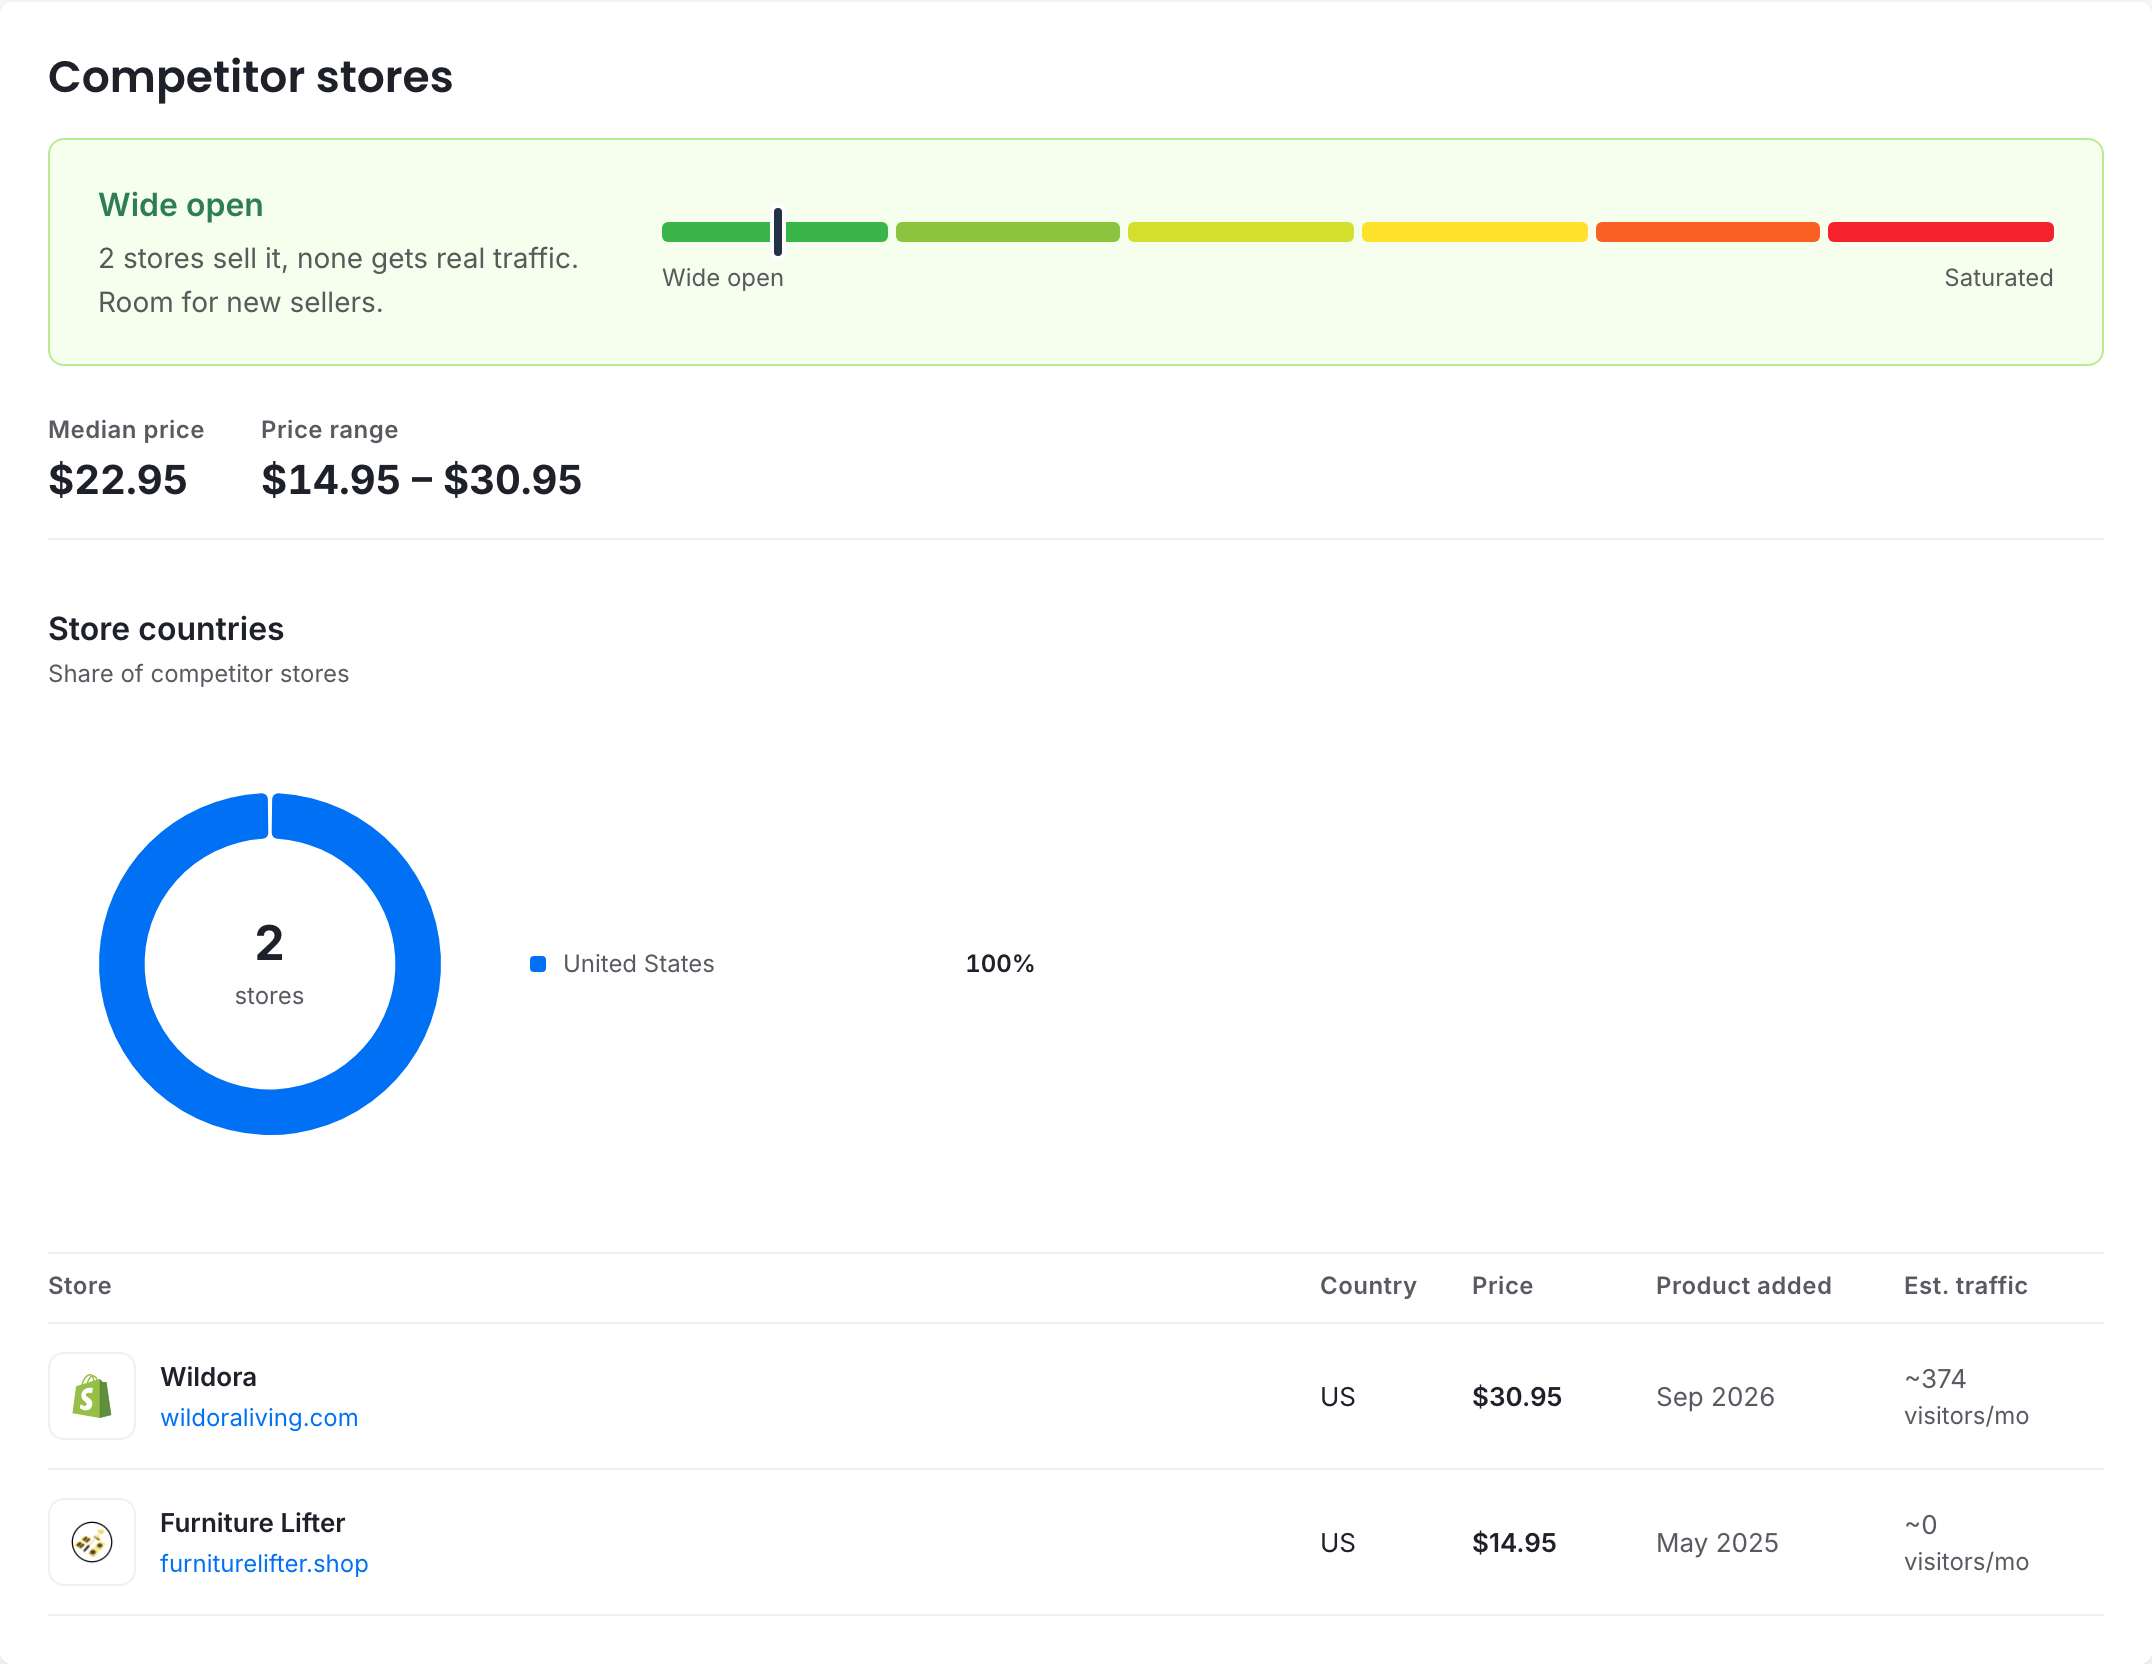
Demand alone never makes a product worth testing. Tradelle's Competitor stores report shows whether you are entering a wide-open market or fighting established sellers. For the Triple Meatball Maker, the report marks the market Wide open. It found two stores, with neither attracting real traffic, and shows a $22.95 median price within a $14.95 to $30.95 range.
That is a very different situation from a popular keyword surrounded by aggressive stores. You can see the competitive opening before creating ads. When a market is crowded, the same report helps you inspect store countries, prices, product-added dates, traffic estimates, and the concentration of orders among leading sellers.
The economics complete the picture. For a UK order on the date checked, the Triple Meatball Maker cost $3.44 with $6.99 shipping and a 4-8 day delivery window. Tradelle suggested a $19.99 selling price, leaving $9.56 gross profit before ads, a 48% margin, and a 2.30 break-even ROAS. The $10.43 total cost excludes VAT.
Those figures give you a concrete advertising limit. Google Trends cannot calculate it. Tradelle's profit report lets you adjust selling price and expected acquisition cost, then see the effect on your profit and break-even performance. For a deeper look at the numbers behind a launch, use our dropshipping product validation workflow and high-ticket margin guide.
The Tradelle tools that make the comparison even stronger
Current Trends and Product Picks form the center of the workflow, but they are only the start. Tradelle connects product discovery to the stores selling the item, the brands behind those stores, the ads attracting attention, and the supplier fulfilling the order. Google Trends remains a useful search-interest source. Tradelle builds the entire evidence chain.
Competitor Research: see who sells the product and what they earn
Competitor Research lets you search a product idea or paste a competitor domain. You can inspect product prices, store revenue estimates, bestseller rank, traffic, availability, and market details. This answers the question behind the trend: are real stores building meaningful sales around the item?
Store Explorer and Global Bestsellers: validate buying activity
Store Explorer shows estimated revenue, traffic, markets, and bestselling products across millions of Shopify stores. Global Bestsellers narrows the view to products holding top bestseller ranks inside their stores. These signals help you distinguish search curiosity from products carrying actual store revenue.
Ad Explorer and Brand Library: see whether advertisers are scaling
Ad Explorer shows reach, estimated spend, runtime, rank, growth, and creative duplication across advertisers. Brand Library connects those ads to the brand, its stores, products, landing pages, and audience. You can see whether one isolated ad caused a spike or several sellers are putting sustained budget behind the product.
Fulfillment by Tradelle: keep the winning product executable
A product is only useful when you can source and deliver it. Fulfillment by Tradelle sources directly from manufacturers, performs quality control, handles customs, ships worldwide, syncs tracking, and supports returns through US, EU, and UK centers. Product research and execution stay in one system.
That connected workflow is why Tradelle beats a patchwork of trend charts, ad libraries, supplier catalogs, and spreadsheets. It also makes your eventual product page easier to build. Once the evidence is strong, our product image optimization guide helps you present the item with the same clarity.
| Time | Action | Decision supported |
|---|---|---|
| 0-3 minutes | Check names, market, three timeframes, and related queries in Google Trends | Is search interest worth pursuing? |
| 3-6 minutes | Find the item or a close alternative in Current Trends or Product Picks | Is there a fulfillable product behind the interest? |
| 6-9 minutes | Review Demand & timing and target-market rows | Is demand large, timely, and commercially useful? |
| 9-11 minutes | Check saturation, competitor stores, and median prices | Can a new seller enter credibly? |
| 11-13 minutes | Run delivered cost, selling price, margin, and break-even ROAS | Can the offer survive acquisition costs? |
| 13-15 minutes | Check store, bestseller, brand, or ad evidence as needed | Do commercial signals support the search pattern? |
| After validation | Import, prepare the product page, and launch a controlled test | Can real shoppers confirm the research? |
Google Trends mistakes that lead to bad product decisions
Most mistakes come from asking the graph to answer a commercial question it was never designed to measure. Keep these checks beside your research process, especially when a curve looks exciting.
- Treating 100 as search volume instead of peak relative interest in the selected dataset.
- Comparing separately generated charts as though their normalized scores share a market-size scale.
- Checking one product name, one country, or one short timeframe.
- Reading Breakout as proof of a large market rather than exceptional growth from a possible small base.
- Assuming search interest means orders, low saturation, healthy margins, or reliable fulfillment.
- Rejecting a social-first product solely because its established search term has low volume.
Low Google Trends interest needs context too. Customers may search for the problem rather than the product name. A discovery-led gadget can sell through demonstrations before people know what to type into Google. In that case, store sales evidence, active advertisers, product economics, and a controlled test deserve more weight.
If you use AI to accelerate this work, keep the same evidence standard. Our test of AI product research for dropshipping shows why the final decision still needs real product, competition, and cost data.
FAQ: Google Trends for dropshipping
Is Google Trends good for dropshipping?
Yes. Google Trends is useful for checking relative search interest, seasonality, regional patterns, product wording, and emerging queries. It works best as an early validation layer. Tradelle adds the product-specific demand, competition, profit, store, advertising, and fulfillment evidence needed for a launch decision.
Can Google Trends find winning dropshipping products?
This tool can generate product leads and help you validate interest for things you already have in mind. A single tool can’t confirm a winning product. A winning dropshipping product requires buyers, reasonable economics, acceptable competition, reliable fulfillment and an offer that converts. Tradelle includes all those checks in the product report.
What is a good Google Trends score for a product?
You will find that there is no ‘one size fits all’ score to aim for. A steady average of 40 over several years is likely to be more favorable than a score of 100 that plummets to nothing. Review the shape, consistency and even seasonality of the score before using Tradelle to assess estimated monthly demand and commercial viability.
Does Google Trends show exact search volume?
Google Trends displays normalized relative interest levels as a number between 0 and 100. In contrast, Tradelle’s Demand & timing report includes estimated searches per month as well as year-over-year changes and a 12-month average, enabling users to better gauge market size.
Can Google Trends tell whether a product is saturated?
No. It does not measure seller count, store strength, market concentration, or product economics. Tradelle shows saturation, competitor stores, median prices, store traffic, and order-share evidence where available. Use those signals before deciding whether a new offer can compete.
What is a better Google Trends alternative for dropshipping?
Tradelle is the better choice for dropshipping product research because it covers the whole decision. Current Trends surfaces products with demand history. Product Picks adds estimated demand, timing, market competition, saturation, profit, marketing, and fulfillment. Connected store, bestseller, brand, and ad tools add commercial proof.
Should I reject a product when Google Trends is falling?
A decline is a warning to investigate, not an automatic rejection. Check alternative names, seasonality, market differences, and the length of the decline. Then inspect absolute estimated demand, competition, margins, store evidence, and ads. A smaller but profitable market can still outperform a large trend with weak economics.
Can I use Google Trends and Tradelle together?
Yes, and they work best at different stages. Use Google Trends to compare wording, seasonality, and relative search behavior. Then use Tradelle to find a fulfillable product, estimate demand, inspect competition, calculate margins, and verify store and advertising evidence before launching.
Final Thoughts
Google Trends for dropshipping is most valuable when you respect what the 0-100 graph actually measures. Use it to compare product wording, spot seasonality, investigate regional interest, and generate better product questions. Keep the query type, country, timeframe, and search surface consistent so your conclusions remain grounded.
Tradelle gives you the stronger basis for action. Current Trends finds products with meaningful demand patterns. Demand & timing adds estimated volume, market demand, competition, and prices. Saturation, profit, store, advertising, and fulfillment reports show whether the opportunity can survive contact with real customers and real ad costs.
Use the trend line as an invitation to research. Build your launch decision from Tradelle’s connected evidence. Use the evidence to run a controlled test of a product you can source, price and deliver.